Recently, I read an interesting article about NFL Stats that were pretty overrated. Among one of those stats was interceptions, although it was in the sense of interceptions being overrated to judge defensive backs.
Then I thought, interceptions are also a pretty overrated stat for quarterbacks as well. I was originally going to create a stat to judge quarterback interceptions based on interceptable passes, but while I was checking to see if interceptable passes counted as interceptions (which I still do not know), I came across an interesting Football DVOA article.
They created their own Adjusted Interceptions stat based on Dropped/Defended Interceptions, Interceptions on Hail Mary’s and in Garbage Time, and Tipped Interceptions.
I was originally discouraged and considered stopping my quest, but after reading a bit further into the article, I realized that their stat was also somewhat flawed.
One of the main problems was that they assumed that every dropped interception should’ve been caught which is just not realistic. Dropped interceptions happen all the time and you can’t over adjust and assume that every single one should’ve been caught.
Another thing they didn’t do was adjust for caught passes that may have been great plays by the defender, which could’ve been done by finding the natural rate of dropped interceptions (which I did).
These issues caused all quarterbacks to have almost 20% more interceptions than originally, which makes it tough to interpret the stat since it’s so unrealistic. And so, I decided to create my own stat.
My Method
Note that every quarterback included in this metric must have had a minimum of 180 pass attempts during the 2019-2020 NFL Season.
The first thing I had to do was find the catch rate for interceptions which was done by taking the amount of total caught interceptions and divide that by the amount of caught interceptions plus the amount of dropped interceptions.
The catch rate for the 2019 season was around 67.7%. We then used this number to one, multiply that by the Dropped Interceptions of each player, and by the Total Interceptions + Dropped Interceptions before being subtracted by the Total Interceptions after the multiplication, the second of which was multiplied by 0.5.
I not only multiplied by Dropped Interceptions but also multiplied the Total Interceptions including those that should’ve been Dropped because it allows me to factor in interceptions that both should’ve been caught but were dropped, and interceptions that should’ve been dropped (based on the catch rate), but were caught.
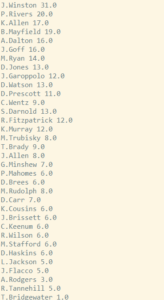
This allowed me to get the stat TrueDroppedInts, a stat that will later be added to total INTs. For now though, here are the leaders in TrueDroppedInts.

The next thing I did was that I also wanted to factor in the fact that maybe some tipped interceptions should’ve been intercepted because the receiver may have been misled causing the interception.
I divided the number of tipped interceptions by the number of total interceptions and then added one. This number was then used as a divisor for the amount of total dropped interceptions. After dividing the number of Tipped Interceptions by this number we get the stat TrueTippedInterceptions.
This number will be subtracted from Total INTs later. Here are the leaders for TrueTippedInterceptions
The last number we need requires no calculation. This number is just simply Hail Mary Interceptions and Interceptions Thrown in Garbage Time.
Dak Prescott and Philip Rivers both led this category with two apiece.
These were subtracted from the interception totals.
The last thing we have to do was adjust to make the interception totals more realistic by multiplying the current interceptions by the overall interception total divided by my interception total and finally round the numbers.
Final Results

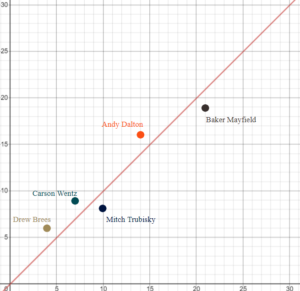
Here’s a little graph to show who the outliers were.
The x-axis represents their actual interception total and the y-axis represents the TrueInterception Total that I have assigned. The red line is the line of best fit.
Anything under the line represents that the player did better than their interceptions show, and anything above the line shows players who did worse than their interceptions show.
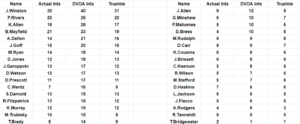
For another comparison let’s look at TrueInterceptions next to DVOA’s Adjusted Interceptions.

Here, you can see my numbers are clearly a more accurate representation of what a QB’s interception total would look like instead of DVOA’s stat which is bloated and makes QB’s look worse.
The Problems
This metric isn’t perfect of course, or else I would likely be working for an NFL team at this moment. One of the main problems was balancing interceptions that should’ve been caught but were dropped and interceptions that should’ve been dropped but were caught.
I valued the dropped interceptions twice as much because you see those much more often than a great play but of course, that number isn’t perfect.
Another issue is that not all tipped interceptions are equal.
A quarterback like Dak Prescott’s TrueInt total would’ve been higher if there was some way to factor in two of his tipped interceptions (both thrown to Amari Cooper, one vs the Packers to Jaire Alexander, and another vs the Patriots to Stephon Gilmore) were both his fault for misleading the receiver.
Not all tipped interceptions are created equally and while I did a better job than DVOA of factoring that in, it’s far from perfect.
DVOA
While I may be creating a metric to compete with DVOA’s metric of Adjusted Interceptions, my method of TrueInterceptions wouldn’t be close to where it is right now. The tipped and dropped passes make my metric so much more accurate than it would have been if I used interceptable passes, and for that, I have to thank them.
Photo Credit: Michael Reaves / Getty Images


